
By Cecily McChalicher | Thu, September 24, 20
Welcome to the latest REED Rendering issue, a series of blogs where we bring your attention to interesting trends that we see in the data and the stories behind those trends.
As the COVID-19 pandemic stretches into its seventh month, we all continue to feel its impacts in many different aspects of life. I fall into the pool of parents with elementary school-aged children who rallied for a spring of homeschooling, but are now feeling less than enthusiastic about another school year of balancing the demands of home-based schooling and professional obligations. However difficult they may feel, the pandemic-related planning challenges I face on a personal level pale in comparison to the planning and performance challenges facing energy efficiency program administrators in the COVID-19 era. After many years of energy efficiency program growth and rising energy savings, COVID-19 presents a bump in the road. The question is whether COVID-19 is a speedbump with only minor, short-term program impacts or a pothole that will significantly lower energy savings on a longer-term basis.
In the NEEP region, the annual energy savings achieved by energy efficiency programs steadily increased throughout the past decade, both in MWh and as a percentage of sales, which led to aggressive annual electric energy savings goals for several Northeast states. For example, Massachusetts’ 2019-2021 annual savings goal is 2.7 percent of retail sales, Rhode Island’s 2018-2020 annual savings goal is 2.6 percent, and Vermont’s 2018-2020 goal is 2.3 percent. These are some of the highest goals in the nation.
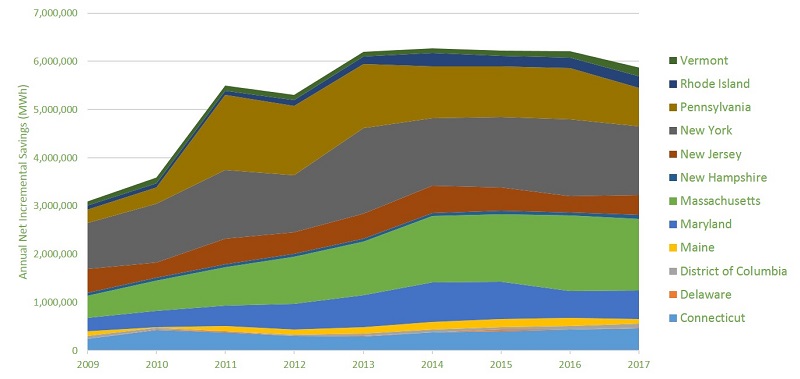
Figures 1 and 2 below, largely based on data from the Regional Energy Efficiency Database (REED), show that these annual goals are realistic and achievable when considering program results from the last decade. Figure 1 shows regional annual incremental electric savings growing substantially from ~3.1 million MWh in program year 2009 to ~5.8 million MWh in program year 2017, the most recent year of REED data. NEEP has faced its own pandemic-related interruption with REED data collection and is currently wrapping up program year 2018 data collection, but expects this upward trend would continue if the 2018 data were included.
FIGURE 1: INCREMENTAL ANNUAL ELECTRIC ENERGY SAVINGS (2009 – 2017)

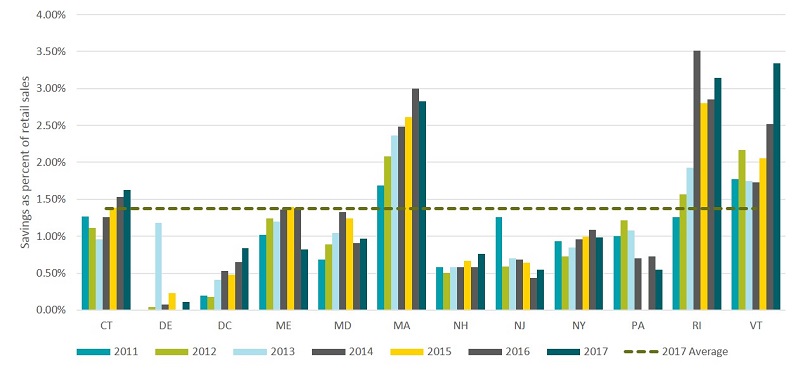
Figure 2 shows that annual electric energy savings as a percentage of sales also trended upward in many states in the region from program years 2011-2017, averaging 1.38 percent in 2017, an increase from 1.31 percent in 2016. Vermont and Rhode Island achieved over three percent of annual electric sales in 2017, with Massachusetts not far behind at just under three percent.
FIGURE 2. SAVINGS AS A PERCENT OF SALES, ELECTRIC PROGRAMS (2011-2017)

Savings Progress in Question
The COVID-19 pandemic, however, has drawn into question whether energy efficiency programs can hit their aggressive energy savings goals for 2020 and the years to come. Many energy efficiency programs were shut down entirely in the pandemic’s early months, as the pandemic affected in-home energy audits and other in-person work (i.e. installing energy efficiency measures). Furthermore, some customers are choosing to delay energy efficiency investments either due to financial hardships or the desire to keep their money in the bank. A May 2020 report by E2, E4TheFuture, and the American Council on Renewable Energy (ACORE), Clean Energy Unemployment Claims in Covid-19 Aftermath, found that the clean energy workforce lost 620,000 jobs from March to May, with roughly 70 percent of the job losses attributed to slowing energy efficiency work.
In response to these pandemic-related program challenges, many utilities that paused or discontinued programs are now seeking alternative ways to engage customers and continue work towards meeting energy savings goals. These alternative strategies include providing energy efficiency tips, promoting easy-to-install efficiency measures (such smart thermostats, efficient lightbulbs, smart power strips, etc.), and providing virtual audit or pre-assessment solutions. Many states across the NEEP region have also increased incentive levels. For example, Massachusetts increased some incentive levels in its small business program to 100 percent. In Vermont, VEIC doubled the incentive for cold climate heat pumps from $300 to $600 per outdoor unit and increased the incentive for heat pump water heaters from $150 to $250. In New Hampshire, incentive caps were also raised for programs to encourage participation and support contractors as they re-enter the market.
The question remains, how will these pandemic-related changes in program delivery and incentive levels affect annual energy savings? A survey of executives from the ESource Demand Side Management Executive Council revealed that a majority expected their annual savings to decrease by at least 11 percent and upwards to more than 20 percent. However, a strong majority of executives expected their savings goals to stay the same. Energy efficiency program planning efforts across the region bear this out, with some states continuing with business as usual and setting continued high savings targets in current planning cycles because the long-term impacts of COVID-19 are unclear. For example, Pennsylvania recently approved the implementation of the five-year (2021-2026) fourth phase of its Act 129 energy efficiency programs, with a goal of reducing energy consumption by 3.1 percent statewide during the plan period. New Hampshire’s recently released 2021-2023 Statewide Energy Efficiency Plan calls for the New Hampshire utilities to achieve cumulative energy savings of five percent on the electric side and three percent on the gas side, both of which are an increase from the 2018-2020 Plan. Many states across the region have also opened dockets to examine the pandemic’s impacts on ratepayers, programs, and utility costs in order to help guide their program planning processes. These state activities are outlined in NEEP’s August 2020 Policy Tracker.
Looking into the Future
The uncertain and changing energy efficiency program environment in the COVID-19 era brings forward the need for more rapid program performance feedback to better understand how programs are doing and to plan for the future. The traditional energy efficiency program reporting model based on annual program results can help us look at trends over time, as the REED data demonstrates, but the associated data lag makes it less helpful for today’s dynamic program environment.
New EM&V approaches, known as Advanced M&V or M&V 2.0, are coming online that can provide this rapid feedback and reporting. M&V 2.0 provides more timely results by utilizing software that can quickly process data and provide information to program coordinators in months rather than years. That information can then be utilized while the program is still in progress, rather than only being able to reflect after the fact. Broader implementation and use of M&V 2.0 across the region would be extremely helpful during the COVID-19 era to more quickly and thoroughly understand the impacts of new energy efficiency program delivery models that have been put into place to provide for safe program implementation.
As the country continues to navigate the COVID-19 pandemic over the coming months, its impact on energy efficiency program savings and future goals will become clearer. NEEP will continue to monitor these changes and regularly provide updates on its Covid-19 Resource page and through other publications. Later this fall, another year of REED energy efficiency program data (program year 2018) will also be available by request. While REED data cannot be used to explore pandemic-related program impacts due to the data lag, it does provide a multi-year foundation of program impacts leading up to the COVID-19 era. NEEP will also continue to support M&V 2.0 work across the region as the evaluation paradigm evolves from a focus on annual program impacts to more rapid feedback, a timely shift for the COVID-19 era. Time will tell how big the COVID-19 bump in the road will be for energy efficiency programs, and NEEP will be closely following and reporting on these developments.


