
Guidance and Metrics for Implementing Decarbonization Policies
States are in the early stages of rolling out policies designed to meet aggressive carbon reduction goals. A key part of a successful transition will be a robust evaluation, measurement, and verification (EM&V) process to provide feedback and guidance as states decarbonize. Current and recommended strategies for building decarbonization leverage existing energy-focused activities from a variety of separated sources: utilities, state and local governments, and private sources or partnerships.
|

|

|
|
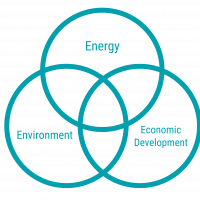
GHG sources are siloed by state regulations. Decarbonizing the grid means blending state agencies and goals together to combat interdependencies on GHG sources. |
Pathways to mitigation vary widely by state but need to be collected into one source to ensure progress. |
The magnitude and pace of change will expand available data. States will need to be flexible and nimble in identifying priorities and how best to achieve them. |
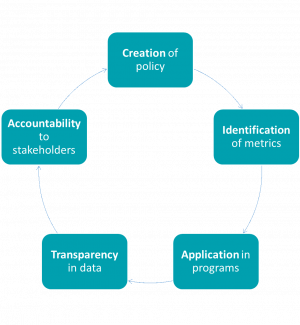
A robust Advanced M&V (M&V 2.0) process will break down these silos to allow for comprehensive evaluation of state decarbonization goals. The traditional EM&V approach evaluated and verified energy efficiency program performance on an annual basis. Advanced M&V (M&V 2.0) looks to accelerate and re-invent this process by providing access to data at more frequent intervals and transforming EM&V into a policy implementation accountability process to set and measure decarbonization, resiliency, and equity goals.
| Traditional EM&V Process | Advanced M&V (M&V 2.0) |

|
|
|
The traditional EM&V framework evaluates energy efficiency programs. Regulatory orders typically set out requirements for customer-funded energy efficiency programs to be evaluated. Evaluation protocols and methodology address costs, investments, and energy savings, with evaluations, performed separately for each utility program administrator. The result is one-way communication via program evaluation that focuses on savings targets and budgets. |
Advanced M&V (M&V 2.0) looks to change the purpose and role of evaluation so that it can be used to account for, understand, improve, and communicate the results of multiple activities geared towards a goal or policy. State’s decarbonization policies are more encompassing than traditional utility energy efficiency programs and will involve the blending of different policy priorities in energy regulatory space. The result is a holistic process with accessible and understandable data to aid in achieving highly aggressive state carbon goals. |
Click on the policy below to see how Advanced M&V can help states track progress towards these policy goals.
Carbon Reduction Policy Metrics
States are setting ambitious carbon goals as climate strategy, but it’s important to acknowledge that carbon reduction occurs in many spheres. For energy efficiency, achieving carbon goals cost-effectively represents a paradigm shift in program planning – away from strictly energy efficiency and towards carbon efficiency. This can be done through utilizing the following metrics:
- Cost Benefit Testing – Costs of Carbon: Cost benefit testing inventories all costs and benefits of programs, but these tests often account only for utility costs and energy savings. Adding a monetary metric like the social cost of carbon or a per ton emitting fee to the cost benefit test allows for proper valuation of the costs of carbon. This metric would quantify economic harm from carbon and climate change impacts such as extreme weather events, rising sea levels, food insecurity, and other disasters that are typically not included in the analysis. Additionally, if done with proper consensus, the social cost of carbon or a per ton emitting fee can be used in other state agencies to calculate avoided carbon for projects in various sectors.
- Tracking and Reporting – Carbon Emissions: Most energy efficiency programs currently track and report energy and demand savings and program expenditures. Adding carbon emissions allows states to catalog carbon so that it can be used later as states move to deeper decarbonization policies including cost effectiveness testing, Energy Efficiency Resource Standards (EERS) goal setting, performance incentives, and system planning.
- Lifetime Savings Targets: Energy efficiency program savings targets typically focus on first-year or near-term energy savings because this approach makes it easier to describe, measure, and plan programs. But these policies may unintentionally favor measures with high first-year savings, which are unlikely to continue to deliver savings over the long term. Additionally, a focus on first-year savings does not easily translate to resource planning and climate investment settings where long-term impacts are important. By shifting program targets or adding a lifetime savings target in addition to a first-year annual target, states can more accurately measure the expected savings over the full life of a measure. Further, it can encourage implementers to invest in more long-term savings measures, which will help states as they look to lower carbon and energy consumption more permanently. For more on this topic, see a 2019 ACEEE report, Energy Efficiency over Time: Measuring and Valuing Lifetime Energy Savings in Policy and Planning.
- Fuel Neutral Savings Targets: Current energy efficiency programs are classified as electric or gas programs, with targets defined as either gas or electric savings. But to complete a transition to a carbon free or carbon neutral grid, states will need to lower consumption of all fuels and convert a majority of end uses to electric. Fuel-neutral (MMBtu) targets properly account for the fuel usage in both electric and gas power and allow utilities to claim savings for fossil fuel-powered end uses that are converted to electric. To implement initially, states can combine a broader MMBtu savings target with a subset of kWh and therm savings targets.
Equitable Energy Policy Metrics
Grid decarbonization will impact everyone, most especially underserved and marginalized communities. This provides opportunities to address systemic racial inequities in housing and environmental justice. National and state level efforts are tackling these issues head on: the New York Climate Leadership and Community Protection Act requires 35 – 40 percent of overall benefits to go to underserved communities, and on the national level, President Biden has signed an executive order that creates a government-wide Justice40 Initiative with the goal of delivering 40 percent of the overall benefits of relevant federal investments to underserved communities.
Applying the correct metrics to design and track implementation of these equity policies holds programs accountable to these goals and aids in the design of more targeted programs.
- Cost Benefit Testing- Equity Metrics: Cost benefit testing inventories all costs and benefits of programs, but unfortunately in most states, these tests only account for utility costs and energy savings. Adding metrics that account for environmental impacts of programs, including health and air emissions, and encourage investment in low income or small business programs can embed equity policy in cost benefit testing and encourage utilities and implementers to design portfolios that better incorporate state equity policy. Some metrics to consider are:
- Public Health Benefits: Data shows that pollution from power plants causes serious health issues. Energy efficiency programs lower emissions from power plants by reducing energy use and can alleviate issues caused by surrounding air pollution. This results in tangible benefits such as reduced health care costs (largely due to fewer respiratory and cardiovascular problems/diseases), fewer premature deaths, and fewer missed work and school days. The National Standard Practice Manual for DERs (NSPM) identifies public health as a commonly considered non-utility system societal impact of energy efficiency programs.
- Low Income and/or Small Business Benefits: Low income and small business energy efficiency investments provide significant benefits outside of those accounted for in a state’s typical cost benefit test. These benefits include health, safety, comfort, economic and community stability, and workforce opportunities. These benefits can be captured by including an adder or multiplier for programs that target underserved communities and/or small businesses. Accounting for these benefits in a cost benefit test will encourage utility and other implementers’ portfolios to be designed to deliver them. For more information on how to include this in a state cost benefit test and examples of what other states have done, see Non-Energy Impacts Approaches and Values: an Examination of the Northeast.
- Tracking and Reporting - Equity Metrics: Similar to tracking and reporting carbon policy, using metrics that align with a state’s equity goals can ensure that programs designed to meet these goals are successful. Tracking these metrics can also allow implementers and other stakeholders to find any gaps in participation based on incentive, marketing, or program design. These metrics can include: participation by zip code, income level of homes served, number of participants, and single- or multi-family homes.
- Low Income and Small Business Savings Targets: Current energy efficiency program goals usually focus on energy savings. While a savings target is valuable, it can sometimes lead administrators to overlook other important considerations – such as equity and accessibility – in delivering programs. Including a savings target that requires a portion of savings from environmental justice, moderate- and low- income, small business, and/or other areas identified by state policy will encourage programs to be designed to deliver to these areas, ensuring equitable access.
Market Transformation Policy Metrics
States are setting ambitious climate goals to meet the urgency of the moment. A key part of these goals will be transitioning to a clean energy market which requires spurring technology innovation, accelerating the transition to electrification, and identifying and training a new workforce based on clean energy technologies and building management.
Advanced M&V can help states track and monitor these policies in more detail in both energy efficiency programs and on the statewide level.
- Cost Benefit Test – State Specific Test: Cost benefit testing inventories all costs and benefits of programs, but unfortunately in most states, these tests only account for utility costs and energy savings. Each state has a unique energy and policy landscape. As part of the transition to a cleaner grid, states should look to establish their own cost benefit test to ensure that the test properly accounts for its unique situation. The National Standard Practice Manual for DERs (NSPM) provides guidance on principles and approaches to the development of energy program cost-effectiveness tests by jurisdictions. New Hampshire recently applied the NSPM framework to develop the state’s new cost benefit test.
- State Climate Plan Metrics – In addition to modifying the energy efficiency EM&V framework, states can create their own climate goals framework through a state report or creation of an agency that will oversee climate efforts. Decarbonization policies impact more stakeholders and sections of the state than previous energy or environmental policies. Centralization of state climate goals can ensure accountability and progress. These goals can also apply to multiple sectors, which can help siloed agencies move towards a more cohesive goal. Maine set goals in its recent four-year climate plan Maine Won’t Wait. The state highlighted that these “goals are critical for informing the public about whether policies are having the intended outcomes and for making evidence-based adjustments, enhancements, or replacements to policies in pursuit of our 2030, 2045, and 2050 targets.” Some goals in the proposal include: energy saved via ongoing efficiency measures, created clean energy jobs, electric vehicles on the road, total plug-in EVs, total heat pump installations, and leveraged investment funding.
Data Accessibility Policy Metrics
New decarbonization policies also bring about changes to the use and amount of data. Integration of new technology and implementation of a flexible grid will require a new understanding of energy data and usage patterns by program developers, regulators, and consumers. Further, this data should be accessible but also protected to ensure that customers can utilize these programs without any risk to their privacy.
These metrics are not core components of the traditional EM&V framework because they look to gather more granular data and incorporate an additional level of transparency to the EM&V process.
- Collection of AMI and Metered Data: Collection of advanced metering infrastructure (AMI) data is growing nationally and in the Northeast region. This technology serves as a platform for real-time energy management and allow customers to better understand their energy use and opportunity for savings. Prioritizing the collection and utilization of this data in program evaluation is valuable as it can help to design more innovative programs and verify the success of pilot programs. In addition to aiding in program design, AMI and metered data can be used to inform consumers of their energy use patterns and incorporate new technology onto the grid (i.e. solar and storage). States can make this data more accessible to consumers through Home Energy Reports, bill alerts, or other avenues that provide and utilize data to raise consumer knowledge of their energy use.
- Creation of a State Level Data Hub: Making data available on a centralized, transparent platform, such as a website, is helpful to ensure stakeholders can find and use the data. These publicly available data resources also create more public accountability. States can use these platforms to measure program success and allow public access to data in a user-friendly format. New York has developed the New York State Clean Energy Dashboard and allows users to download the underlying data on Open NY. This practice, as well as additional efforts to increase regional transparency and standardization of reporting practices and terms, helps ensure energy data can be used appropriately and in a meaningful way by diverse audience groups to improve building decarbonization programs.
- Utilization of Regional Level Data: Regional energy data collection and standardization of reporting practices encourages coordination on environmental and energy policy and allows stakeholders to benefit from a common understanding of energy efficiency and clean energy policies and data. NEEP’s Regional Energy Efficiency Database (REED) provides a regional look at annual energy efficiency program results across the Northeast and Mid-Atlantic regions for program years 2011-2018. Additionally, NEEP maintains a Building Energy Benchmarking Dashboard that displays key data collected through benchmarking efforts in the region. As the region looks to transition to Advanced M&V, regional data hubs, like REED and the Benchmarking Dashboard, provide access to data that may otherwise be unavailable and promote coordinated regional discussion about evolving energy policies and metrics.
Whole-Building Decarbonization Policy Metrics
Existing buildings are one of the largest emitters of carbon, accounting for 40 percent of the country’s greenhouse gas (GHG) emissions. To help reduce emissions from this sector, many cities and states are using whole-building decarbonization policy strategies. By looking at how a building’s energy use changes over time, states can assess changes in individual homes and buildings’ carbon footprints and monitor the building sector’s contributions to meeting state energy and environmental goals. Additionally, taking inventory of building emissions can aid in designing and implementing a carbon neutral or zero carbon grid, as these grids will likely require buildings to act as flexible resources.
Measuring these policies will require new metrics that shift from a focus on individual measures to larger system impacts and total building energy use.
- Cost Benefit Test –Flexible Energy Metrics: Cost benefit testing accounts for energy use or savings of a measure using pre-determined energy estimates based on general modifiers such as seasonal usage patterns and estimated savings. Valuing energy usage in this way does not account for grid flexibility resources that can help reduce demand during peak times. Through utilizing end use load profiles (EULPs), which use real-time metered data to quantify how and when energy is used by a measure or building, states can more properly assess the impact of a program on the grid. EULP data supports energy and peak demand savings calculations for program evaluation and design and provide additional insight on savings potential. As states implement decarbonization policies, use of EULPs will be key to properly assessing the benefits of new, flexible technologies on the grid. These technologies include equipment controls, heat pumps, EV charging stations, and strategic electrification to provide data on time and location of energy consumption.
- Benchmarking: Benchmarking is the process of measuring and tracking the actual energy consumption of a whole building. Once collected, benchmarking data can be used to make comparisons to other similar peer buildings, the same building at a past point in time, analyze progress towards goals, and assess energy consumption pre-and-post upgrades. To learn more about the details and implementation processes for benchmarking visit NEEP’s Benchmarking Toolkit. Benchmarking is also the first step in implement Building Performance Standards (BPS). BPS is a policy that requires building owners to take action to reduce energy and/or carbon output. To learn more about implementation of Building Performance Standards and the impacts on decarbonization policy, see NEEP’s Building Energy Performance Standards Policy Considerations Brief. NEEP also maintains a Building Energy Benchmarking Dashboard that displays key data collected through benchmarking efforts in the region.
- Building Energy Labeling: Building energy labeling is the process of measuring and disclosing energy usage and rating data for a building. Providing building energy usage metrics as a public facing measure of consumption can encourage building owners to invest in efficiency and clean energy. At scale, these strategies can lead to market transformation and valuation of energy efficiency and clean energy in real estate markets. To learn more about the implementation and collection of data for Building Energy Labeling see NEEP’s Energy Rating work.