By Cecily McChalicher | Thu, December 6, 18
Welcome to the latest REED Rendering issue, a series of blogs where we bring your attention to interesting trends that we see in the data and the stories behind those trends.
This Thanksgiving, before filling up on turkey and pumpkin pie, my two young daughters and I tuned in to the 2018 National Dog Show to watch Whiskey the Whippet dominate the competition and win the title of ‘Best in Show.’ After all, why watch football or jog in a Turkey Trot in single-digit weather when we could join 20 million other people watching adorable (or huge and intimidating) dogs strut their stuff?
Scorecard rankings
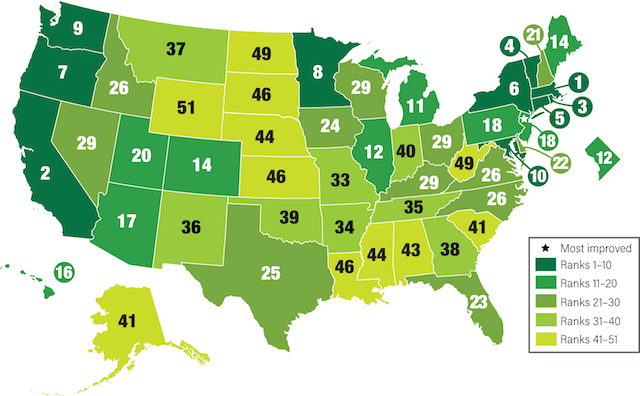
Back at work on Monday, I found myself digging into ACEEE’s 2018 State Energy Efficiency Scorecard report for a project, and my thoughts turned to how the Northeast region effectively takes the ‘Best in Show’ title when it comes to energy efficiency. Of the top 10 states in ACEEE’s rankings, six are states in the NEEP region: Massachusetts, Rhode Island, Vermont, Connecticut, New York, and Maryland, with Massachusetts capturing the #1 spot again this year. Two additional jurisdictions in the NEEP region, Maine and Washington, D.C., are in the top 15. These states lead the nation in their energy efficiency policy and program efforts, ranked highly by ACEEE in a variety of categories including utility programs and policies, transportation policies, building energy efficiency policies, combined heat and power, state government initiatives, and appliance efficiency standards.

Looking further into the Scorecard’s results, the only two states in the country to achieve all 20 possible points in the ‘Utility and Public Benefits Programs and Policies’ category (which accounts for 40 percent of a state’s total score) were New England states: Massachusetts and Rhode Island. Another New England state, Vermont, was a close third with 18.5 points. This is the fourth year in a row that these three states led this category. ACEEE determined state scores in this category “on the basis of their performance in implementing utility-sector efficiency programs and enabling policies that are evidence of a commitment to energy efficiency.”
Best in Show
While energy efficiency program scoring metrics may not be as immediately interesting as some of the National Dog Show metrics like attitude, gait, muzzle length, and whisker thickness, they are important for understanding and benchmarking energy efficiency program performance. Tracking energy efficiency program performance over time helps states better understand program strengths and possible areas for improvement, and keeps state eyes on the prize of excellence.
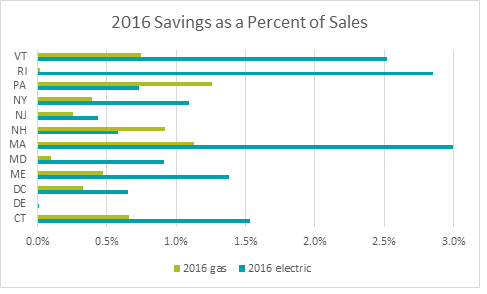
ACEEE’s Scorecard considers several utility program scoring metrics that are also publicly accessible through NEEP’s Regional Energy Efficiency Database (REED). One of these metrics is energy efficiency program savings as a percent of sales. The graph below shows 2016 annual electric energy savings reaching an impressive 2.5 to three percent of sales in Rhode Island, Massachusetts, and Vermont. These levels of savings are among the highest in the country! NEEP is in the process of updating REED with 2017 program year energy efficiency data, which will be available in spring 2019.

Rhode Island’s impressive results have been galvanized by the state’s ambitious Three Year (2018-2020) Energy Efficiency Plan, as well as a state goal to reduce GHG emissions 80 percent by 2050. Massachusetts has also demonstrated its continued strong commitment to energy efficiency with its new Statewide Three-Year Energy Efficiency Plan for 2019-2021 that calls for an investment in energy efficiency programs of $2.77 billion, over $200 million more than the 2016-2018 Three-Year Plan. This impressive level of investment is dwarfed by the anticipated $8.5 billion in customer benefits resulting from the Plan, which will help Massachusetts achieve its economic, environmental, and job creation goals. Legislation from 2018 also enables new technologies, including storage and active demand management, to participate in energy efficiency programs. Earlier this year, Vermont passed a bill that added efficiency standards for 16 appliances (including computers and monitors, air compressors, and commercial cooking equipment) to the state’s appliance efficiency law. The total annual energy and water savings resulting from these standards is expected to equal about $17 million. Vermont is one of a few states to receive points for appliance standards in the Scorecard. Like other Northeast states, Vermont demonstrates its commitment to energy efficiency on a multi-year basis, with Efficiency Vermont’s Triennial Plan (2018-2020).
REED and the ACEEE Scorecard
Investment in energy efficiency programs is another state metric included in the REED database and considered by ACEEE in its Scorecard. REED provides total annual expenditures on efficiency programs for each participating state, and goes a step further by parsing out expenditures into particular categories, such as customer incentives, marketing, and research and evaluation. REED data shows that in 2016, 78 percent and 81 percent of energy efficiency expenditures went to customer incentives in Massachusetts and Rhode Island respectively, with four percent and nine percent being used for program administration. REED’s added layer of expenditures data is a great way to see how these substantial investments in energy efficiency in the Northeast are being used.

The Northeast states’ high ranking in ACEEE’s Scorecard, and the ‘Utility and Public Benefits Programs and Policies’ category in particular, is likely to continue going forward thanks to the region’s strong multi-year commitments to programs. REED is an excellent complementary tool to ACEEE’s analysis that can be used to track the region’s energy efficiency program results over time, with data from 2011-2016 (and soon to be 2017). The REED data shows that all signs point to the Northeast region’s continued position as “Best in Show” in energy efficiency.
Looking into the future, as the focus on decarbonization increases, there may be a need for the region and for REED to incorporate additional energy efficiency program performance metrics. As the energy efficiency landscape shifts, NEEP will continue to assess which metrics are most useful for understanding energy efficiency program performance and provide that information in a useful format like REED.
