

By Cecily McChalicher | Thu, December 17, 20
Happy holidays and cheers to the New Year! 2020 has been a year of unprecedented challenges. The global pandemic forced people to learn new technological skills to work from home effectively, but also gave families more time to be present with one another and pursue hobbies they’ve never had time to try before. In addition, quarantine reduced pollution levels significantly. During the early lockdown period, Venice’s canals were clearer than they have been in decades, two months of pollution reduction in China has saved tens of thousands of lives, and New York researchers found a 50 percent drop in carbon monoxide levels. This shows that once we've saved ourselves from the virus, we have the ability to save the planet from our actions.

|

|
At the close of an unpredictable and tumultuous year, we are pleased to see that energy efficiency in the NEEP region still shows extremely promising efforts and outcomes! The Regional Energy Efficiency Database (REED) is now populated with NEW program year 2018 data! REED serves as a platform for consistent reporting of the Northeast and Mid-Atlantic region’s electric and gas energy efficiency programs and contains 2011-2018 program level data for the following 11 jurisdictions: Connecticut, Delaware, the District of Columbia, Maine, Maryland, Massachusetts, New Hampshire, New Jersey, New York, Rhode Island, and Vermont. (Data is not provided for all 11 jurisdictions for all years.)
The database contains information on annual and lifetime energy savings, peak demand savings, avoided air emissions, program expenditures, job creation impacts, cost of saved energy, and supporting information. By gathering this information in one central repository, REED is used to inform state and regional policies, as well as state benchmarking and other research and analysis. NEEP currently offers the following two resources updated with the 2018 data by request:
- A Master REED Workbook (in Excel format) containing program level data for years 2011-2018. The workbook includes an “all data” worksheet with program data from all states and all years, and individual state-by-state worksheets.
- A REED Supporting Information report that complements data collected for REED and helps ensure informational transparency. While some of the energy efficiency program metrics REED includes are consistent across jurisdictions, state reporting of energy efficiency program impacts, EM&V practices, and approval processes vary across the region in a number of ways. This report highlights some of these state differences to ensure the REED data is not misconstrued or misrepresented. The report begins with general supporting information which provides detailed information on the metrics that REED provides, along with a number of additional resources. Following the general supporting information, an overview of relevant state program administrators and reporting practices is provided for each REED jurisdiction.
Overall Findings for Program Year 2018
Energy efficiency is the fastest-growing jobs sector in the energy industry, accounting for about half (76,000) of the entire energy industry’s new jobs (151,700) in 2018. Investments in energy efficiency programs are robust across the Northeast and Mid-Atlantic region. In 2018, total energy efficiency program investments averaged $45 per capita, holding steady with the last several years. Most energy efficiency investments in the NEEP region are directed towards electric programs, largely because avoided costs for electricity are higher than for natural gas. The average 2018 per capita electric investment was $35, on par with 2017. States in the REED region are national leaders in electric energy savings as a percent of sales, helped by aggressive state energy policies. The 2018 electric program savings averaged 1.39 percent of retail sales, keeping pace with 2017. For 2018 natural gas and fuels program, the region averaged savings of 0.56 percent of retail sales, an increase from 2017. Many takeaways can be gathered from the 2018 data, and we will highlight two below.
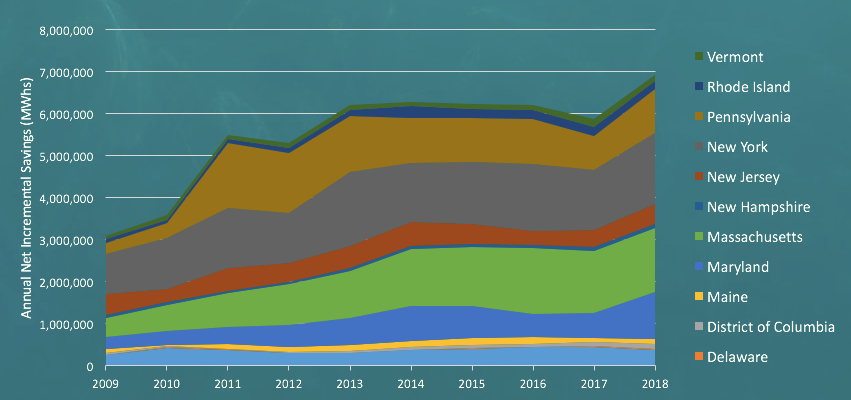
Overall Increase in Electric Energy Savings: Annual electric energy savings have gone up significantly from 3.1 million MWh in 2009 to 6.9 million MWh in 2018, pushed by strong state commitments to energy efficiency policies and programs across the region.
Efficient products programs, such as Lighting/Appliance program types, were a large contributor in 2018’s extensive electric energy savings. Residential lighting programs offered by state program administrators achieve a large amount of net annual energy savings in energy efficiency program portfolios. Even programs not categorized as Lighting/Appliance programs can achieve a good portion of energy savings through lighting measures. For example, some commercial and industrial retrofit programs achieved about half of their program savings through lighting measures. In Massachusetts, the Lighting/Appliance program type comprised nearly 40 percent of the state’s 1.5 million MWh of 2018 savings; and in Vermont, about one-third of its electric program savings can be attributed to programs with emphasis on lighting.
Mid-Atlantic Program Progress: Both Maryland and the District of Columbia saw jumps in their energy savings in 2018. For example, the REED data shows that electric savings as a percent of sales in the District of Columbia grew from 0.84 percent in 2017 to 1.22 percent in 2018. These jurisdictions are showing their leadership through aggressive state energy policies. Maryland saw success in passing the Clean Energy Jobs Act, which increased the state’s renewable electricity standard to 50 percent of the total grid by 2030 and requires the state to examine pathways for achieving 100 percent clean power by 2040. Energy policy in Washington D.C. is guided by the most ambitious legislation in the nation: The Clean Energy Act DC. Targets under these policies include 100 percent renewable energy by 2032, building energy performance standards, transportation electrification and a number of other initiatives. The DC SEU achieved 227,414 MWh in electric savings across both FY2017 and FY2018, which represents 187 percent of the minimum cumulative benchmark and 131 percent of the maximum cumulative benchmark for the second year of its contract. The 227,414 MWh figure represents 49 percent of the minimum five-year cumulative benchmark and 39 percent of the maximum benchmark.
State Highlights
Maine: In fiscal year 2019, the Efficiency Maine Trust finalized a number of studies to better understand the potential for cost-effective energy savings and the market channels for energy efficiency measures under Triennial Plan IV, which guides program years 2020-2022.
Massachusetts’s 2019-2021 Plan includes a fuel-neutral goal, GHG reduction and net benefits goals, and annual and lifetime resource-specific goals. The 2018 Act to Advance Clean Energy broadened energy efficiency to focus on reducing overall energy use (strategic electrification, fuel conversion to renewable energy sources and other clean energy technologies). Program administrators will not recommend one fuel over another, but rather provide education about environmental costs and benefits of fuel switching measures.
New York’s fuel-neutral goal includes 185 TBtus total annual site energy savings from 2015–2025, relative to forecast energy consumption in 2025. Plus an electricity sub-target for electric efficiency savings to hit three percent of sales by 2025, and a clean heating target.
Looking Ahead
Energy efficiency programs within the region are gaining traction and seeing many successes. States throughout the NEEP region are prioritizing climate goals and working to decarbonize the economy by integrating zero carbon energy, deep energy efficiency, and strategic electrification into their plans. They are developing policies and programs to streamline this integration process. For an 80 percent reduction by 2050 from all sectors, states need to invest further in energy efficiency, strategically electrify end-uses (building HVAC and transportation), and power the grid with renewable energy.
Further information about REED can be found on the NEEP REED webpage. Please contact Cecily McChalicher, Research & Analysis Manager, with any questions about REED or to request the REED data and supporting information.