By Samantha Caputo | Thu, May 31, 18
Welcome to the latest REED Rendering issue, a series of blogs where we bring your attention to interesting trends that we see in the data and the stories behind those trends.
Improving the energy efficiency of our buildings has long been understood as a way to reduce energy costs and consumption, and improve the health of our environment. Utilities implement various types of programs in the residential, low-income, and commercial and industrial (C&I) sectors to achieve targeted levels of energy savings, with some states such as Massachusetts and Rhode Island achieving about three percent savings. This level of savings is significant, but more can be achieved by identifying the program areas that still have untouched opportunity. The graph below shows 2016 energy savings by program type. Here we can see that lighting and appliances, and C&I retrofits have achieved over half of total program savings.
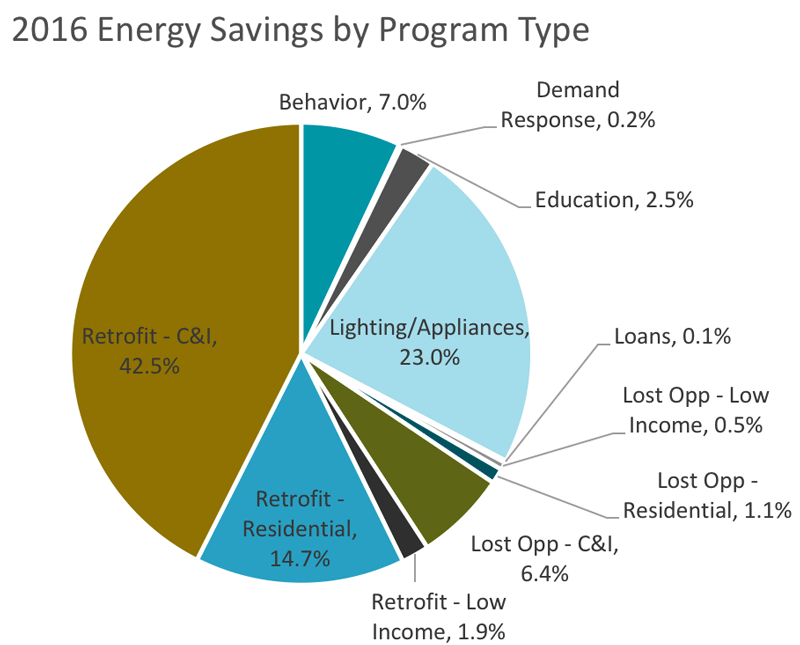
There has been a lot of discussion lately around what utilities will do to achieve the same level of energy savings when they are no longer able to attribute energy savings from LEDs to utility programs and incentives. There is still opportunity for energy savings from lighting by focusing on underserved communities such as rural and low-income urban markets. By ensuring equitable access to energy efficient lighting products through local retailers or by promoting utility-run programs, such as home energy assessments that provide lightbulbs to customers, these underserved communities will be able to benefit from the transition to more energy efficiency lighting.
The graph also shows that compared to the 43 percent savings from commercial and industrial retrofits and 15 percent residential retrofit savings, low-income retrofits only account for two percent of energy savings. A majority of low-income residents live in multifamily housing. There are many barriers that program administrators face when delivering energy efficiency to the multifamily sector due to the complex nature of ownership, utility metering, and financing structures. In order to address these barriers, utilities can provide building owners and landlords with streamlined access to building energy usage and performance that will enable a focus on whole building deep energy efficiency retrofits. Offering higher rebates, enhanced technical assistance, and customized outreach and marketing for low-income multifamily buildings can help building owners recoup investments in energy efficiency without having to raise the rent on tenants, many of whom wouldn’t be able to afford the rent increase.
When utilities design their energy efficiency program plans, they include planned benefits and the benefit/cost ratio. Massachusetts is currently drafting its 2019-2021 triennial plans and has increased the level of planned low-income benefits from the previous 2016-2018 plan. Low-income, as currently drafted, will account for 8.1 percent of total electric plan benefits (12.7 percent of budget) and 17.4 percent of total planned gas benefits (21.7 percent of budget). This strong focus on low-income customers will help increase the level of savings achieved in the low-income sector.
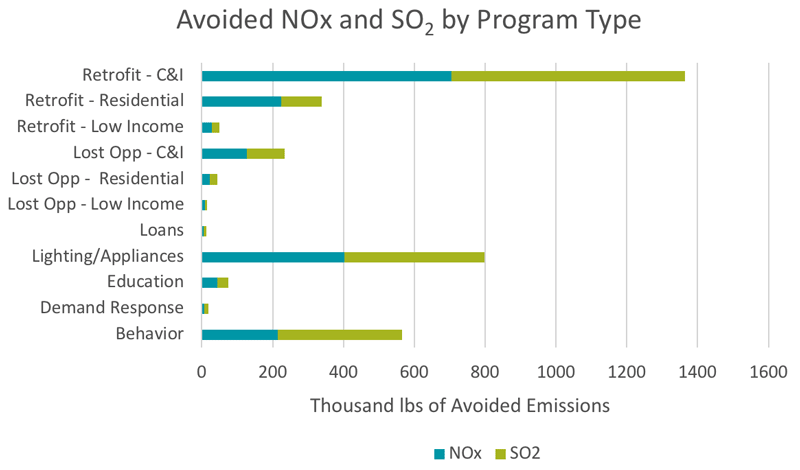
Increasing access of energy efficiency benefits to the low income sector will also bring non-energy benefits, such as improved health from avoided emissions. Energy efficiency is able to reduce the emissions of potent pollutants such as sulfur dioxide (SO2) and nitrogen oxides (NOx) by avoiding generation from fossil fuel resources. This graph shows the level of NOx and SO2 that these programs have avoided. Managing the public health burden of ambient air pollution such as NOx and SO2 is often considered separate from energy efficiency, but including health benefits in the evaluation of energy efficiency programs will increase overall benefits. The energy savings lead to a reduction in asthma symptoms, emergency room visits, cases of bronchitis, fewer missed days of work, and decreased premature deaths. The following table shows the estimated Massachusetts low-income household and societal non-energy impacts per weatherized unit with and without the avoided death benefit. Red text indicates the estimate excludes the avoided death benefit.
|
NEI Value |
Annual Per Unit Benefit* |
||||
|
Household w/ Avoided Death Benefit |
Household w/o Avoided Death Benefit |
Societal |
Total w/ Avoided Death Benefit |
Total w/o Avoided Death Benefit |
|
|
Tier 1 |
A |
B |
C |
A+C |
B+C |
|
Reduced asthma symptoms |
$9.99 |
$9.99 |
$322.01 |
$332.00 |
$332.00 |
|
Reduced cold-related thermal stress |
$463.21 |
$4.67 |
$33.73 |
$496.94 |
$38.40 |
|
Reduced heat-related thermal stress |
$145.93 |
$8.28 |
$27.00 |
$172.93 |
$35.28 |
|
Fewer missed work days |
$149.45 |
$149.95 |
$37.36 |
$186.81 |
$186.81 |
|
Tier 2 |
|||||
|
Reduced use of short-term, high interest loans |
$4.72 |
$4.72 |
$0 |
$4.72 |
$4.72 |
|
Reduced CO poisoning (5-year life) |
$36.98 |
$0.25 |
$1.87 |
$38.35 |
$2.12 |
|
Tier 3 |
|||||
|
Increased Home Productivity |
$37.75 |
$37.75 |
$0 |
$37.75 |
$37.75 |
|
Reduced Home Fires |
$93.84 |
$9.77 |
$17.87** |
$111.71 |
$27.77*** |
|
Annual Total - Per weatherized home |
$941.87 |
$224.88 |
$439.84 |
$1,381.71 |
$664.45 |
Source: E4TheFuture, Occupant Health Benefits of Residential Energy Efficiency, Pg. 24
While the region has done a substantial job in achieving high levels of energy savings in various program types, leading to noteworthy avoided emissions, there is still ample opportunity in the low-income sectors to increase savings. Other programs that should be expanded to ensure equitable access to energy and cost savings include demand response and educational programs. Increasing education opportunities across sectors will help customers understand the potential savings energy efficiency programs can bring them.
One way to achieve increased savings in the low-income sector is to value the health benefits as well as those derived from avoided emissions in cost effectiveness testing. Utilities and health organizations may benefit from seeking ways to collaborate to increase the energy efficiency of housing given the growing body of evidence of health benefits. This may present another way to overcome some of the institutional barriers that utilities face in reaching the low income sector. The table below shows the estimated emissions outputs and values per MWh for avoided greenhouse gases in the state of Maryland.
|
Greenhouse Gas |
GHG equivalencies, in CO2 equivalencies |
Pounds per MWh generated, “NEB-It” factors, avg. Maryland generation mix |
Pounds per MWh generated using EIA Maryland factors |
|
Sulfur Dioxide |
0 |
1.805 |
2.3 |
|
Nitrogen Oxides |
310 |
1.956 |
1.3 |
|
Carbon Dioxide |
1 |
1054 |
1333 |
|
Total pounds Carbon dioxide equivalents per MWh using Maryland generation mix |
1660 |
1736 |
|
|
Value per kWh saved at $X per ton CO2 10 per ton CO2 (very conservative) $20 per ton CO2 (conservative/used in remainder of report**) $100 per ton (used by environmental groups, etc.) (NOTE: Alternate values for $/ton may be selected) |
0.84 cents/kWh 1.7 cents/kWh** 8.4 cents/kWh |
||
|
Multiplied times 1271 average kWh saved by MD pgm |
$22/hh at $20/ton** (Alternates: CO2 ($11/hh at $10/ton CO2; $110/hh at $100/ton CO2) |
||
|
Multiplier per kWh compared to residential rates of 13.7 cents per kWh in Maryland |
12% adder** (6% adder at $10/ton; 60% adder at $100/ton) |
||
This shows the added value energy efficiency programs will achieve in avoided emissions if these non-energy impacts are included in cost-effectiveness testing. NOx is produced by road transportation and in areas of high motor traffic, such as in large cities, the amount can be significant. It is also produced from energy production and distribution and energy use in the buildings sector. NOx gases react to form smog and acid rain, and are central to the formation of fine particles (PM) and ground level ozone, all of which are associated with adverse health effects. Therefore, energy efficiency programs not only lead to avoided emissions, but the avoided emissions then lead to improved health benefits.
1 *For CO poisoning, the annual NEI is to be applied over the 5-year life of the CO monitor. The remaining NEIs are to be applied annually over the life of the relevant measure (e.g., 20 years for weatherization).
**For home fires, the societal benefit value of $17.87 includes avoided injuries ($17.60) and deaths ($0.27) to firefighters only ($17.60 + 0.27= $17.87). Avoided injuries and deaths to occupants are categorized as a household benefit (as with all other applicable NEIs).
***The value in this column (“Total W/O Avoided Death Benefit”) has been adjusted to remove not only the household avoided death benefit but the firefighter avoided death benefit of $0.27 reflected in Column C; therefore, this value is not a true sum of Column B + C. The calculation that reflects the adjustment is as follows: $9.77 + ($17.87- $0.27) = $27.37.