
By Aditi Dalal | Wed, April 19, 23
After a busy winter of collecting, organizing, and analyzing new 2020 data for the Regional Energy Efficiency Database, NEEP is excited to share some new trends and results. This blog highlights how the latest REED data offers insight into regional trends.
Expenditures Per Capita
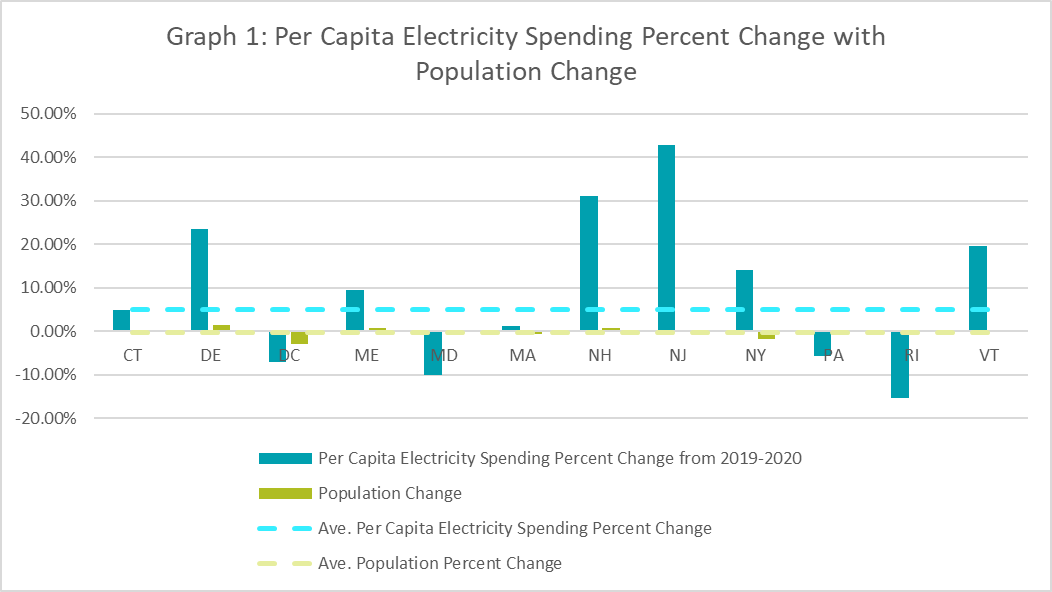
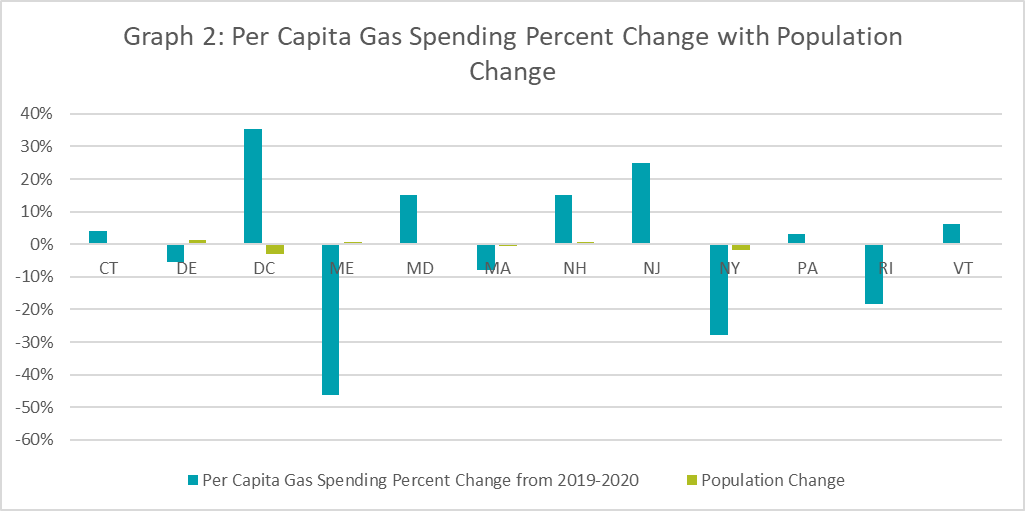
In 2020, states in the Northeast and Mid-Atlantic increased per capita spending for electric programs, while decreasing spending for gas programs. Below we break down which states experienced the most drastic changes in program spending and provide an overlay of the policy landscape at that time. We would like to clarify that these policies did not necessarily cause the changes in data. Our aim is to highlight states that saw these changes and give information about the status of policies at that time.
Electric Expenditures Increase
In Graph 1 we see that per capita spending for electric programs slightly increased for a majority of the states in the region from 2019 to 2020, while only seeing minimal population changes. On average, the region saw about a five percent increase in electric program spending. New Jersey and New Hampshire saw the highest increases. New Jersey experienced about a 43 percent increase from 2019 – 2020. While New Hampshire, saw approximately 31 percent increase.
In 2019, New Jersey also made strides policy-wise to prioritize in energy efficiency. The state published an Energy Master Plan, setting a goal to reduce energy use in the state by 20 percent by 2020. The state also passed legislation which set energy efficiency resource standards for natural gas and efficiency programs. Savings that natural gas programs will be required to achieve are 0.5 percent savings. Electric programs will be required to achieve two percent savings.
Gas Expenditures Decrease
When looking at per capita spending for gas programs in Graph 2, we see that a majority of states saw a slight decrease in gas efficiency spending. New Jersey and Washington D.C. saw the largest percentage increase in spending with New Jersey at about 35 percent and Washington D.C. at around 25 percent. But, on average, states saw gas spending decrease by about four percent, with minimal population changes. Maine and New York had the largest percent decreases in spending. Maine’s investment in gas dropped by about 46 percent, while New York had a decrease of about 28 percent.
When looking at what was happening on the policy level, the period between 2019 and 2020 saw Maine shift policy towards efficient electrification initiatives with legislation and a new climate plan. The state passed a bill to install 100,000 heat pumps by 2025. Additionally, it published an ambitious climate action plan, Maine Won’t Wait, increasing heat pump targets and accelerating other initiatives in the state 250,000 heat pumps.
2020 Annual Savings
With an increase in electric program spending per capita, and a slight decrease in gas spending per capita, let us look at overall savings experienced by programs and see if there are common trends.
Electric Annual Savings Increase
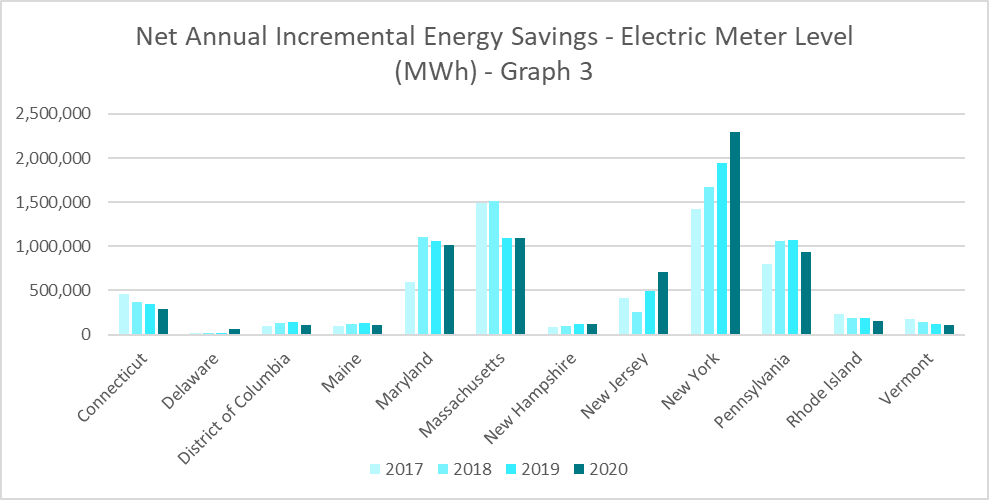
Graph 3 illustrates the increase in electric energy savings from 2019 to 2020. Just as we saw an increase in electric spending, the region also saw an increase in annual electric savings. On average, the region saw a 4.6 percent increase. New York saw the biggest increase in savings with 2.3 million MWh saved in 2020, an 18 percent increase from 2019.
On the policy level, over the past couple of years, New York has made significant changes to its regulation and requirements for energy efficiency programs, including a transition to MMBtu fuel-neutral program goals. Additionally, the state’s energy efficiency programs prioritize both energy efficiency and electrification equally. Finally, New York had also started its Clean Heat Program, which set mandatory heat pump installation targets for every utility in the state.
Gas Annual Savings Decrease
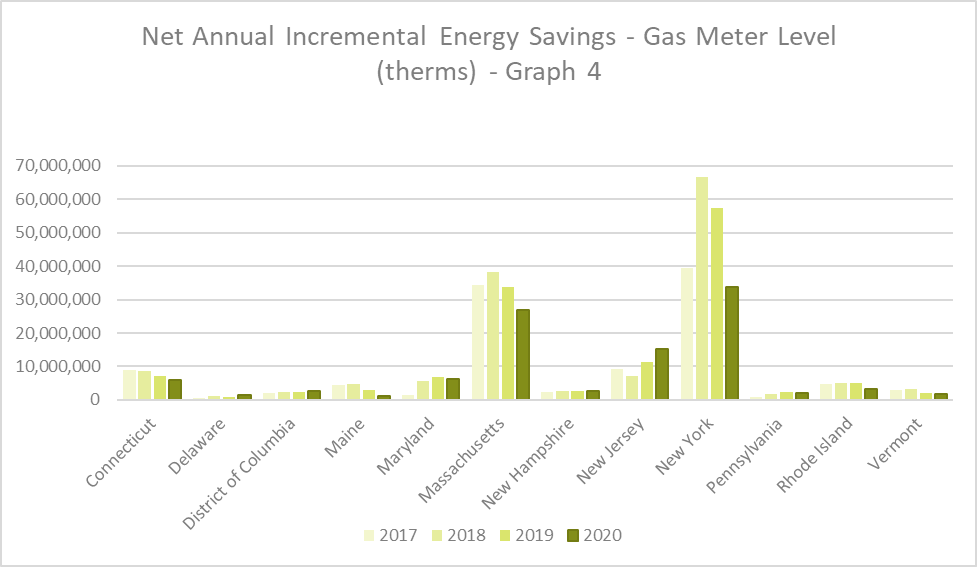
When looking at net annual incremental gas savings, there was an average decrease of 23 percent across the region. Taking a closer look at the state level, Maine and New York saw the biggest decrease in savings with Maine experiencing a 57 percent decrease in annual gas savings. New York had the second highest, with a 41 percent decrease in annual gas savings. On the other end of the spectrum, Delaware and New Jersey trended opposite of other states and increased their gas program savings. Delaware increased annual gas program savings by 34 percent. While New Jersey, came in a close second to achieve a 33 percent increase in their statewide gas savings.
Takeaways
The new REED data shines a light on the status of energy efficiency program investments and savings trends throughout the region. Delaware and New Jersey both saw an increase in savings and spending for gas and electric programs. Some Northeast states, like Maine and New York, decreased program spending and reported lower energy savings than the previous year as well.
Future trends of state annual savings for both gas and electric programs are likely to change in the upcoming decade. Especially as will we now see investment and growth incoming from the Inflation Reduction Act (IRA). The IRA is a first-of-its kind investment in energy efficiency programs, which could lead to an increase in spending and savings for energy efficiency programs everything.


