By Dave Hewitt | Fri, March 22, 19
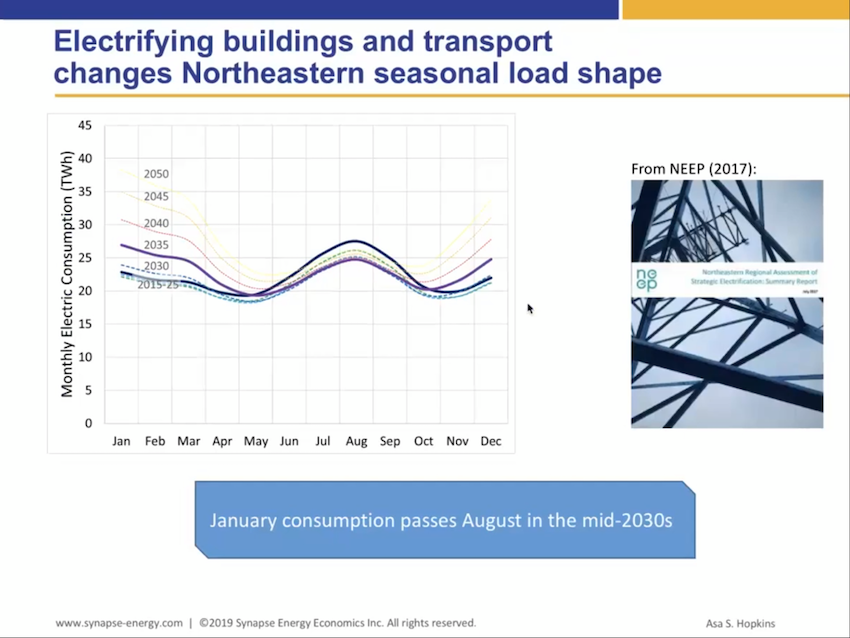
You’ve probably seen the infamous “duck graph”, and then hopefully you’ve read “Teaching the Duck to Fly”. Well, now maybe we have the next example of zoomorphism in the energy world – the butterfly graph.
If we electrify vehicles and buildings, we use more electricity, which is hopefully renewable and close by (reduced transmission and distribution infrastructure). Currently, most utilities in the U.S. are summer peaking, but when we electrify buildings in heating climates, they will become winter peaking. The butterfly graph is seasonal loads, not hourly demands. The pretty yellow parts of the butterfly are hard to see, but as we move 25 or 30 years out, the amount of electricity needed becomes significantly larger. Like double the current winter usage. That electricity needs to be generated and moved to where it is needed.

Without going further into electricity planning issues, the important part is that building decarbonization needs to include efficiency in the building shell, very efficient heating equipment, and smart controls to keep costs lower for all consumers. Peaks are expensive to hit, and you have to build the electric system to have enough capacity to handle the peak demands placed on it. You can reduce peaks by reducing loads and controlling the timing of loads. Some of the things building decarbonization can do to reduce loads last the lifetime of the building and lots of equipment can last 15 to 20 years, so we need to get it right the first time
This initial butterfly graph was produced as part of the Northeastern Regional Assessment of Electrification in 2017. You can find a better explanation of the butterfly graph starting on page 58 of the full report. Asa Hopkins led the team from Synapse Energy Economics and Meister Consulting (now part of CADMUS) that produced the report. Now Asa has produced a web presentation on what would happen if electrified buildings (using current technology) meet the Polar Vortex. Who wins? Can we get there?
Asa’s presentation contains a lot of very useful information helpful to assist those working on building decarb build a better understanding of grid issues. Spoiler alert – while there are lots of butterflies, neither Spiderman nor Catwoman make an appearance.
This blog is part of Building Decarb Central, a series of blogs and other resources aimed at providing a constant flow of information on building decarbonization. Be sure to check out our web portal for more stories, resources, and information.
