
By Cecily McChalicher | Tue, October 26, 21
Welcome to the first edition of Regional Energy Data Dives, formerly known as REED Renderings. Regional Energy Data Dives will be a series of blogs taking a wider look at data underlying regional demand-side program trends.
After five years and 19 issues of Regional Energy Efficiency Database (REED) Renderings, we are fondly waving goodbye to our REED-based blog series and launching a broader Regional Energy Data Dive blog series!
This new blog series will go beyond the REED data to take a wider look at data underlying recent regional demand-side program trends. While REED is an excellent tool for providing traditional energy efficiency program metrics like annual electric and gas energy savings, demand savings, and program expenditures in a central, regional repository, it does not capture new metrics and data sources that are increasingly important as states establish more equitable decarbonization policies and design programs to address climate goals.
These new metrics and data sources are highlighted in NEEP’s Advanced M&V – Data and Metrics for Decarbonization Policies resource center, and include carbon savings, equity metrics, and AMI and metering data that provides insight into real-time energy use. REED’s time lag doesn’t capture recent policy and program developments (REED currently includes program results from 2011-2018) but the data will still be a useful foundation for this new blog series. The Regional Energy Data Dives will use the annual REED data as a foundation for deeper analyses and will incorporate new, additional data sources to get a better picture of the quickly-changing energy policy and data environment.
Goodbye Lighting Measures, Hello Everything Else
For our first Regional Energy Data Dive, we’ll be using ISO-New England’s 2021 Energy Efficiency Forecast to demonstrate how additional data beyond REED can lead to more interesting and nuanced energy efficiency program data analyses.
To help inform its forecast, which is updated on an annual basis, ISO-NE collects energy efficiency program data from New England program administrators every year. In addition to using the data for its forecast, ISO-NE sends the data to NEEP for use in REED’s annual data update. Along with the program-level metrics that are included in REED, ISO-NE also collects end-use information, using the following residential end-use categories: HVAC, process, hot water, lighting, refrigeration, and these commercial end-use categories: compressed air, custom, hot water, HVAC, lighting, motors/drives, process, and refrigeration.
This additional level of granularity beyond REED’s program-level metrics provides valuable insight into program trends on the end-use level. One of the most striking end-use level program trends highlighted in ISO-NE’s forecast is the current shift from program portfolios with savings coming primarily from lighting measures to program portfolios with savings from other end-uses.
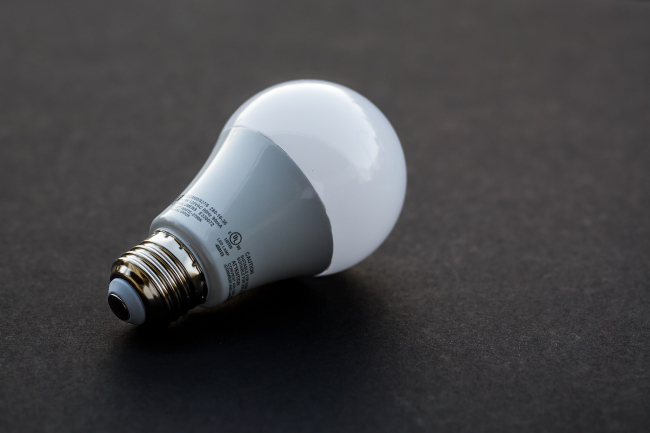
Back in 2019, REED Rendering #12 discussed the transformation of the residential lighting market over the last couple of decades from near-exclusive incandescent bulbs, to a mix of incandescent, halogen, and CFLs, to a mix of LED and halogen. At that time, we anticipated that LEDs would be the predominant type of lightbulb available on most store shelves by 2020. My latest trip to Home Depot bears this out, as I spent a solid 10 minutes wading through the wall of LED bulb options while my increasingly impatient kids begged to go look at the Halloween decorations.
The ISO-NE forecast puts data behind this anecdote, using actual program end-use data and end-use projections to forecast end-use shares through 2030. As we move into the 2020s, the share of savings that comes from lighting measures is anticipated to drop significantly across New England, since the lighting market has been transformed. This projection is most striking in the Massachusetts residential and low-income sector where energy savings from lighting is expected to drop from 60 percent of the program portfolio in 2021 to four percent in 2022. Projections in Rhode Island and Connecticut are nearly as significant, with Rhode Island dropping from 54 percent to seven percent and Connecticut from 68 percent to 35 percent over the same year.
So what’s replacing the lighting savings? The answer is pretty much everything else. In the residential and low-income sector, the biggest projected bump is savings from HVAC end-uses, but savings from all other end-use categories is projected to increase across New England states (with some state-to-state variations). With the lighting market transformed and energy efficiency program savings targets increasing across the region, states are thinking outside the box to design and implement innovative programs that go beyond lighting to capture deeper and broader energy savings.
Program Year 2019 Data Coming Soon!
NEEP is currently collecting the next round of REED data – program year 2019 – and will make it publicly available by request by year-end. The updated REED resources will include:
- The Master REED Workbook (in Excel format) containing program level data for years 2011-2019. This includes an “all data” worksheet with program data from all states and all years, and individual state-by-state worksheets. This video provides an overview of the Master REED Workbook's content and functionality.
- The REED Supporting Information report that complements data collected for REED.
- The 2021 Energy Efficiency Snapshot to showcase Energy Efficiency by the Numbers in Northeast and Mid-Atlantic states. While you’re waiting for the 2021 update, take a look at NEEP’s 2020 Energy Efficiency Snapshot.
To request the Master REED Workbook, please contact Research & Analysis Manager Cecily McChalicher.


