

By Cecily McChalicher | Fri, November 20, 20
Welcome to the latest REED Rendering issue, a series of blogs where we bring your attention to interesting trends that we see in the data and the stories behind those trends.
Two years ago, inspired by my family’s Thanksgiving tradition of watching the National Dog Show, NEEP’s REED Rendering #11 crowned the Northeast Region “Best in Show” for energy efficiency. Fortunately, not even a global pandemic can disrupt the annual National Dog Show, and my daughters are eager to see which dog will earn the “Best in Show” title this Thanksgiving.

Will it be a burly, bulky dog like last year’s winner, Thor? Or a slender, sleek dog like 2018’s winner, Whiskey?
While the “Best in Show” title may go to dramatically different dogs from year to year, “Best in Show” for energy efficiency remains consistent, with New England, and the NEEP region more broadly, continuing its role as a clear national leader.
NEEP Region - State Energy Efficiency Rankings
As in previous years, two energy efficiency data resources, the American Council for an Energy Efficient Economy’s (ACEEE) 2019 State Energy Efficiency Scorecard and NEEP’s Regional Energy Efficiency Database (REED), continue to show the NEEP region’s energy efficiency leadership.
In the 2019 scorecard’s state rankings, which reflect 2018 energy efficiency program savings and spending, four of the top five states are in the NEEP region, with Massachusetts capturing the #1 spot for the ninth year in a row, Rhode Island and Vermont tied for #3, and New York rounding out the top five. California is the sole state in the top five outside the Northeast region, finishing in the #2 spot thanks to its strong leadership in building energy codes, appliance standards, and vehicle emissions limits. Two additional states in the NEEP region, Connecticut and Maryland, are in the top ten at #6 and #7 respectively, while Washington D.C. and Maine also maintain strong positions in the rankings at #11 and #15. All told, of the 11 jurisdictions in the NEEP region that have provided data to REED since program year 2011, 10 are in the top 20 of ACEEE’s rankings, with the 11th REED state, Delaware, at #21.
Jurisdictions in the NEEP region continue to score highly across all of the categories ACEEE uses to inform the scorecard, including utility and public benefits, transportation, building energy policies, combined heat and power, state government initiatives, and appliance standards. For yet another year, the only two states in the country to achieve all 20 possible points in the Utility and Public Benefits category (which accounts for 40 percent of a state’s total score) were New England states: Massachusetts and Rhode Island. Another New England state, Vermont, was a close third with 18 points. The scorecard’s Utility and Public Benefits category is largely based on metrics also included in REED: electricity program savings and spending, and natural gas and fuels programs savings and spending.

The state that earned ACEEE’s Most Improved prize, Maryland, is also in the NEEP region. Maryland jumped up from the #10 spot to #7 thanks to its commitment to expanding its energy efficiency programs over the past several years. The EmPOWER Maryland programs are delivering impressive annual and lifetime energy savings and have a strong annual energy savings goal established by the Maryland Public Service Commission of two percent of gross energy sales through 2023.
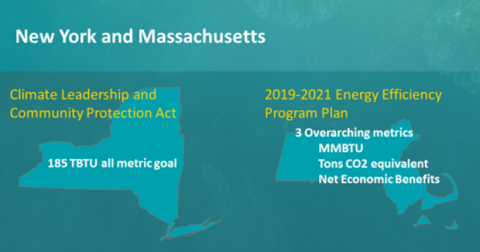
Two other states in the NEEP region, Massachusetts and New York, have taken leadership roles in their approaches to setting energy efficiency program savings targets that better align with strategic electrification and greenhouse gas (GHG) reduction goals. Rather than separating savings goals into fuel-specific categories – MWh for electricity and therms for natural gas – these states are incorporating all-fuels metrics that capture total energy usage and savings no matter the fuel source. Other states in the region are discussing similar changes to their energy savings goals.
REED Data Collection Update
Like many plans and activities in this unpredictable year, NEEP’s annual REED data collection process has been delayed primarily due to the COVID-19 pandemic. NEEP is currently wrapping up program year 2018 data collection for REED and finalizing updated REED resources that include the new year of data from all participating jurisdictions. The REED data is an important complementary resource to the ACEEE scorecard due to its inclusion of program-level energy efficiency program data. This allows for a deeper dive into the savings and spending metrics the scorecard provides at the state level.
NEEP currently offers REED data from program years 2011-2017 from all participating jurisdictions in Excel format, including annual and lifetime energy savings, demand savings, avoided air emissions and program expenditures. In mid-December, NEEP’s very special holiday gift to you will be an updated data file including REED program year 2018 data and a new REED supporting information report. NEEP will also issue an updated edition of the Annual Energy Efficiency Policy Snapshot. Hopefully the 2019 Energy Efficiency Snapshot will tide you over while you wait. All of the REED resources are available by request by contacting Cecily McChalicher, NEEP’s Research and Analysis Manager. We can’t wait to share these new resources with you!
2018 REED Data Sneak Peek
NEEP will provide full regional analysis of the new program year 2018 data when REED data collection is complete next month, but in the meantime, here’s a sneak peek at a high-level takeaway from Massachusetts and Vermont’s 2018 electric program data:
In Massachusetts, the Lighting/Appliance program type remained a large contributor to 2018 achieved annual electric energy savings, comprising nearly 40 percent of the state’s 1.5 million MWh of 2018 savings. Residential lighting programs offered by the state program administrators achieved a large amount of net annual energy savings in the energy efficiency program portfolio. Even programs not categorized as Lighting/Appliance programs achieved a good portion of their energy savings through lighting measures. For example, some commercial and industrial retrofit programs achieved about half of their program savings through lighting measures. Vermont has a similar savings profile for its Lighting/Appliance program type, with about one-third of its total 2018 annual electric energy program savings of ~146,000 MWh coming from efficient products programs that emphasize lighting.
REED Rendering #12 described how the steady transformation of the lighting market to LEDs, particularly in the residential sector, will eventually lower the savings potential of lighting programs as LEDs become the baseline lighting technology. The 2018 data shows that while lighting market transformation may be in progress, it hasn’t substantially reduced the impact of lighting programs just yet. The program year 2019 data, which will be available early next year, may begin to reveal those expected shifts away from savings from lighting programs.
Happy Holidays & Looking Ahead
We wish you all a happy holiday season, whether you spend it with your nose in energy efficiency program data or relaxing on the couch watching the National Dog Show. We hope you can find new and creative ways to connect with family and friends and keep your holiday traditions alive during this tumultuous year. Despite the many challenges that this year has brought, we expect the NEEP region to maintain “Best in Show” and continue its excellence and leadership role in delivering strong and effective energy efficiency programs.