By Samantha Caputo | Tue, March 27, 18
Welcome to the latest REED Rendering issue, a series of blogs where we bring your attention to interesting trends that we see in the data and the stories behind those trends.
Now that the 2016 data has been entered and the dust has settled, this issue will take a deeper dive into the 10 REED states - Connecticut, Delaware, the District of Columbia, Maine, Maryland, Massachusetts, New Hampshire, New York, Rhode Island, Vermont – and the results of the 2016 energy efficiency programs run by those states.
Energy Savings
Each year NEEP reaches out to the states in the region to collect energy savings data for our Regional Energy Efficiency Database (REED). Compared to previous years where the total energy savings reported to REED has increased, 2016 saw a decrease to 4.1 million MWh from what was 4.7 million MWh in 2015. This year, four states in the region saw an increase in annual electric energy savings, which still did not make up for the overall decrease in regional savings. It is no surprise to see Massachusetts represented below with the state achieving over three percent energy savings targets.

There are many factors that can influence the level of savings achieved by states, such as available funding for programs, energy savings targets, support for energy efficiency programs, and more. Even though the savings are not as high as they have been in the past, it is still important to acknowledge the work the utilities are doing to try and implement successful programs.
Avoided Carbon

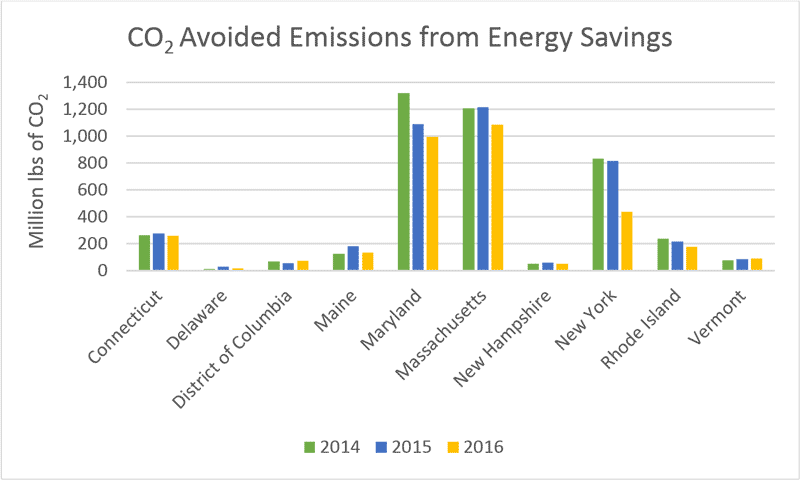
Energy efficiency is a least cost carbon reduction tool. For the energy saved, a level of avoided carbon is achieved. The energy we don’t use equals carbon we don’t emit. The graph shows the level of avoided carbon by state over the past three years from energy savings reported to REED. The region avoided over three billion pounds of carbon emissions in 2016. According to the EPA’s Greenhouse Gas Equivalency Calculator, this is equivalent to carbon emissions from 3,492,913 barrels of consumed oil or 323,058 passenger vehicles driven for one year.
Vermont and Washington D.C. are the two places we continue to see increased avoided carbon emissions from energy savings. This is no surprise with these two states achieving the greatest percent increase in energy savings this year (VT at 19 percent and D.C. at 40 percent). It is important to show this analysis to draw the connection between energy savings and carbon reduction because energy efficiency is a key strategy in achieving carbon reduction goals throughout the region.
A Look at Programs
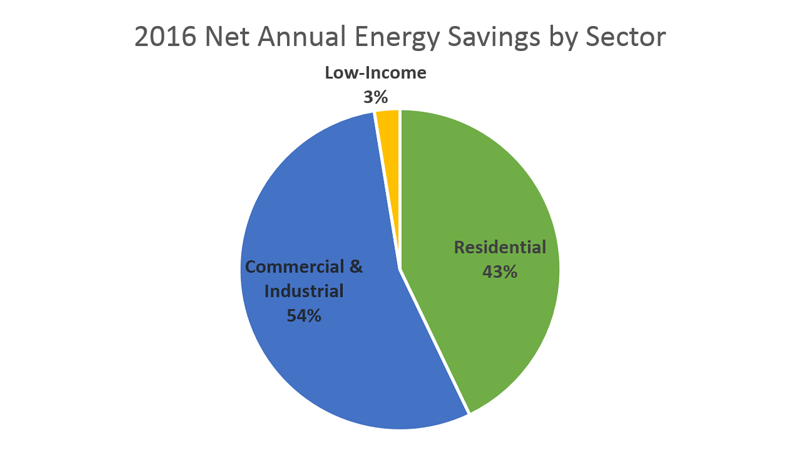
The pie chart below shows how much of the energy savings is achieved by sector. The commercial and industrial (C&I) sector achieved over half of the energy savings in 2016. This includes many opportunities for retrofitting large and small C&I customers, which contributed the most energy savings for C&I at 2.2 billion MWh of energy savings. The low-income sector did not achieve a lot of savings in 2016. Utilities throughout the region are working to provide equitable access to low-income customers to participate in energy efficiency programs. In many cases low-income customers are living in multi-family housing and are confronted with a split incentive with the building owner to complete home energy retrofits. Addressing this split incentive will ultimately increase the level of savings in this sector.

These are just a few ways to use the data in REED. Each quarter, a REED Rendering is published to provide insights into the newest data, draw connections between energy savings and public policy, and showcase new analyses. Stay tuned for the next REED Rendering and in the meantime… visit REED.
